
The cost of unplanned downtime is the sum of six lines for each stop: lost contribution margin, idle crew and overhead, restart energy, quality loss after restart, repair cost and penalties. In the worked example below, an illustrative 8-hour bar mill stop costs ₹23.82 lakh, about ₹3 lakh an hour.
Most plants count only the first line, or two. That is why the number on the maintenance report is lower than the number in the finance review. This post shows each line with a formula, an input source and a rupee example. It also shows when the lost margin is not really lost. If you want to skip the arithmetic, use our downtime cost calculator. Come back here to see what it leaves out.
What goes into the cost of one unplanned stop?
Six lines go into it. Three are almost always counted and three are often missed. Vendor guides such as Innovapptive's downtime costing guide use much the same list. None of them is a standard, so choose the lines that fit your process.
| Line | Formula | Where the input comes from |
|---|---|---|
| 1. Lost margin | Hours × output per hour × margin per unit | Production log, costing sheet |
| 2. Idle crew and overhead | Hours × cost per hour that keeps running | Payroll, shift roster, utility bills |
| 3. Restart energy | Fuel or power burned to get back to rate | Meter readings, past restarts |
| 4. Quality loss | Off-spec tonnes × price gap | QA records for the first hours after restart |
| 5. Repair cost | Parts + contract labour + crane or hire cost | Store issue slips, work order |
| 6. Penalties and extra freight | Late-delivery charges, expedited dispatch | Sales orders, freight bills |
Lines 1 and 2 are what a basic calculator counts. Lines 3 to 6 are the ones that surprise the CFO later. Our ERP integration guide for condition monitoring shows how to get lines 5 and 6 into one work order record, instead of three spreadsheets.
Why use contribution margin and not the selling price?
Contribution margin is the selling price minus the variable cost per unit. When a line stops, you also stop buying the ore, scrap, power and consumables for units you never made. So the real loss is the margin. Using the selling price makes the loss look much bigger than it is, and a finance head will spot that at once.
A worked ₹ example: an 8-hour bar mill stop
The figures below are illustrative. They are not a customer result. They are set to be realistic for a mid-sized TMT bar mill, so replace them with your own. Assume the mill rolls 40 tonnes an hour, the contribution margin is ₹6,000 a tonne, and a gearbox bearing failure stops it for 8 hours.
| Line | Working | Cost |
|---|---|---|
| 1. Lost margin | 8 h × 40 t/h × ₹6,000 | ₹19,20,000 |
| 2. Idle crew and overhead | 8 h × ₹9,000 per hour | ₹72,000 |
| 3. Restart energy | Furnace reheat and mill warm-up | ₹1,50,000 |
| 4. Quality loss | 20 t downgraded × ₹4,000 a tonne | ₹80,000 |
| 5. Repair cost | Bearing, seals, two contract fitters | ₹1,20,000 |
| 6. Extra freight | Expedited dispatch to one customer | ₹40,000 |
| Total | ₹23,82,000 |
That is ₹23.82 lakh for one stop, or about ₹2.98 lakh for each hour of the stop.
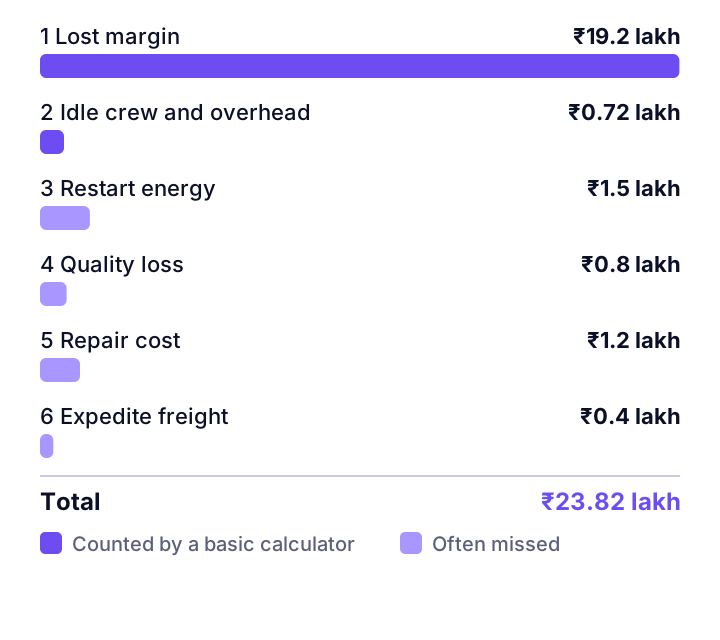
Look at the split. Lines 1 and 2 come to ₹19.92 lakh, which is about 84% of the total. So a basic calculator is not far wrong on a long stop with high margin. It is far more wrong on a short stop. A 40-minute trip that costs ₹1.5 lakh in restart energy and ₹80,000 in off-spec bars hurts more than its lost-margin line suggests.
What does a year of stops cost?
Multiply by how often it happens. Take the same mill with 12 unplanned stops a year that average 6 hours (an illustrative figure). That is 72 hours. Lost margin is 72 × 40 × ₹6,000 = ₹1.73 crore. Idle crew and overhead adds ₹6.48 lakh. Lines 1 and 2 alone give ₹1.79 crore a year.
Our calculator applies a 40% recovery rate to that total, which it describes as deliberately conservative. On this example that is about ₹71.7 lakh a year. Treat it as a ceiling for what condition monitoring could help avoid, not a promise. It cannot stop a power cut or a raw material shortage.
When is lost margin not really lost?
Only when you cannot make the production up later. This is the check that separates a CFO-grade number from a scare number. There are three cases.
| Your situation | What to count for line 1 |
|---|---|
| Sold out, running near full capacity | The full margin. Those tonnes are gone. |
| Spare capacity, can run an extra shift | The cost of the extra shift: wages, power, wear. |
| Demand-limited, stock is piling up | Close to nothing for margin, but check for line 6. |
A mill that runs 20 hours a day and can add 4 more is in the middle row. The 8-hour stop above may cost far less if the plant recovers it over the next two days. But that recovery uses the spare hours you wanted for growth, so it still has a price. Write down which row you are in before you show the number to anyone.
How does the cost change by process?
Continuous processes pay most after the stop, not during it. A kiln or a furnace that stops must burn fuel to come back to temperature, and it makes off-spec product on the way up. A discrete line restarts quickly, but one stopped station can starve the next.
- Steel and rolling mills: reheating furnace fuel, bars rolled out of size at restart, and a billet that cools in the furnace.
- Cement: kiln restart fuel and clinker quality, but a raw meal silo or clinker yard can protect the kiln from some stops. Our cement plant guide ranks machines by kiln hours lost.
- Power and captive plants: the cost is replacement power from the grid or a diesel set, not lost product. See our industry page for power plants.
- Discrete assembly: short restarts, but watch line balancing and delivery penalties.
Do not copy an average from a report. Siemens' 2024 survey of large plants found an hourly cost of about $36,000 in fast moving consumer goods and $2.3 million in automotive (Siemens, The True Cost of Downtime 2024). That is a spread of about 64 times. Siemens also sells predictive maintenance software, so read it as context, not as your number.
Where does this calculation go wrong?
Four mistakes cause most bad downtime numbers.
- Using revenue. The loss looks larger than finance will accept.
- Using shift register hours. Operators tend to round stops up or down and forget the micro-stops. Take hours from the machine event log where you can.
- Ignoring make-up capacity. If you can recover the tonnes, you have counted a loss that did not happen.
- Skipping the repair cost and penalties. They are easy to find. In the example above they add ₹1.6 lakh.
There is one more limit. This model treats each stop as a separate event. It does not capture a stop that damages a customer relationship, or a stop that causes a second failure. Count those in a note beside the number, not inside it, unless you can price them.
How can you use this cost to choose where to invest?
Use the per-hour cost to rank machines, not to justify a purchase in general. A machine with a ₹3 lakh hourly loss and a failure that gives two weeks of warning is a strong case for sensors. A machine with a ₹20,000 hourly loss and a spare on the shelf is not.
Start with three steps:
- List the ten machines that stopped the line most often in the last year.
- For each, fill the six lines using real hours and real invoices.
- Rank by annual cost, then check which ones show warning signs such as rising vibration or temperature. Our guide to predictive maintenance ROI covers the payback step.
The machines near the top of both lists are where condition monitoring pays first. For a short guide to the signals, see vibration analysis basics.
Where Vexron fits
Vexron is our predictive maintenance and industrial intelligence platform. Its product data lists a "Plant Financial Recovery & OEE Hub" with a monetary downtime ledger in INR and USD. That ledger prices stops as they happen, so you do not rebuild the sums each quarter. It does not replace your costing sheet. Margin per tonne, idle crew cost and restart energy still come from your own plant and finance records. See Vexron for what it covers.
Frequently asked questions
How do you calculate the cost of unplanned downtime?
Add six lines for each stop: lost contribution margin (hours × output per hour × margin per unit), idle crew and overhead, restart energy, quality loss after restart, repair cost, and penalties or extra freight. Use contribution margin, not selling price. Then count only the production you could not make up later. Multiply by stops per year for the annual figure.
Should I use revenue or contribution margin for lost production?
Use contribution margin, which is selling price minus variable cost. When the line stops you do not buy the raw material for units you never made. Revenue overstates the loss. If the plant runs near full capacity and every tonne sells, the margin is truly lost. If you can run extra shifts later, count the cost of those shifts instead.
What is the cost of one hour of downtime in an Indian plant?
There is no honest industry average. Siemens' 2024 survey of large plants found a range from about $36,000 an hour in fast moving consumer goods to $2.3 million in automotive. That is a spread of about 64 times. Your number depends on your line output, margin and process. Work it from your own figures.
Does downtime cost differ between continuous and batch plants?
Yes. In a continuous plant such as a kiln, furnace or rolling mill, a stop adds restart energy and off-spec product, so the cost after the stop is long. In a discrete assembly line the restart is usually short, but a stop can starve the next station. Include the restart lines only where your process really has them.
Put your own numbers in
Enter output, margin, stops per year and idle cost to see the annual cost of unplanned downtime for your line.
Downtime cost calculatorExplore Vexron